League Hubs · Updated
English Football Leagues: Tables & Predictions
The top four tiers of English football, each with a live-updating table, our model's predictions and a guide to the best places to bet. Pick a division to dive in.
Four Divisions, Four Different Games
English football runs 92 professional clubs across four divisions, and they do not play the same game. The Premier League is 20 clubs over 38 matches; the three divisions below it are 24 clubs over 46, with play-offs deciding a promotion place and, in League One, four clubs going down rather than three. Those rules are not decoration, they are what a projection has to be built around, which is why each page here uses its own zones.
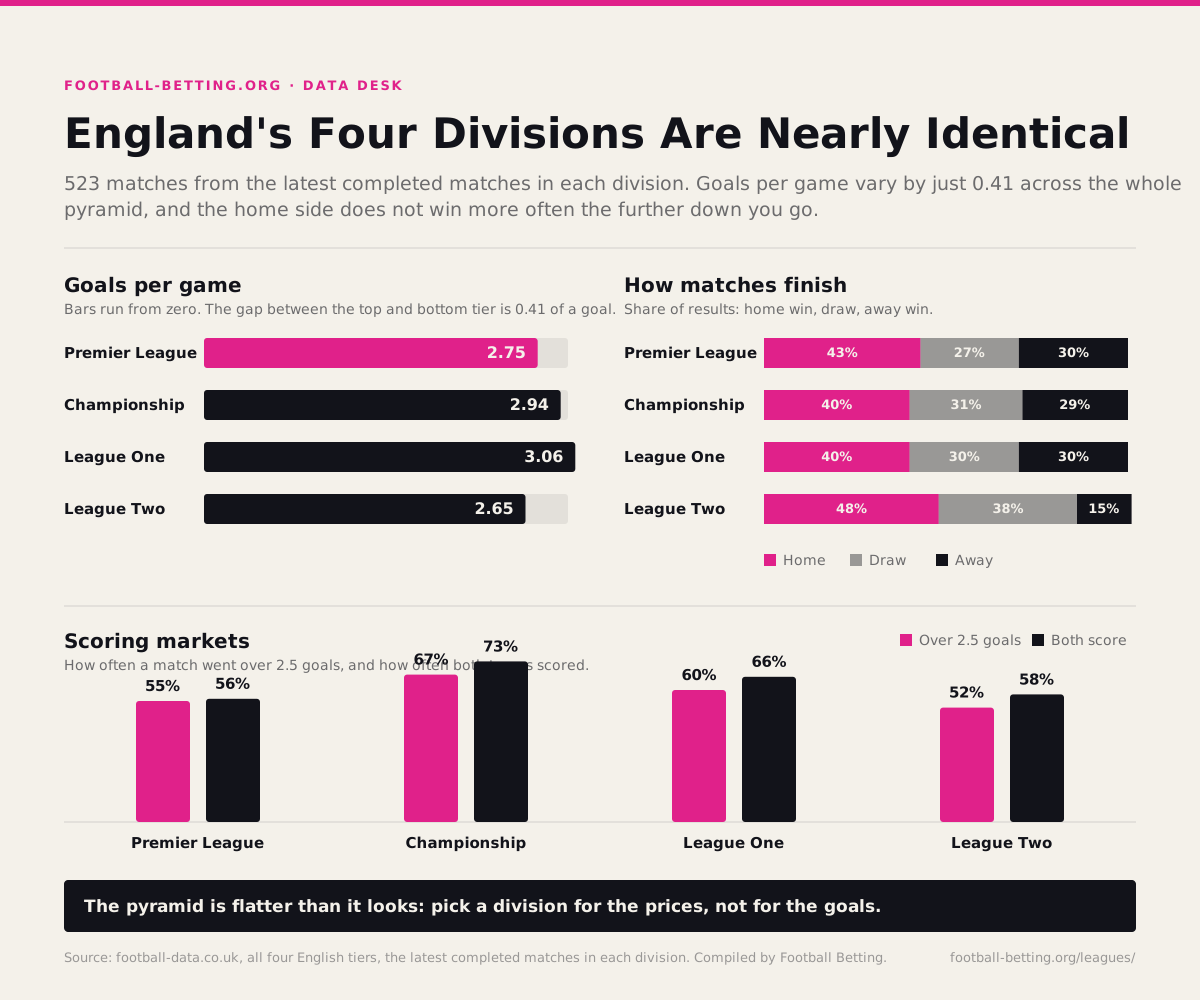
The football differs too, and we can show it rather than assert it. Measured on their own completed matches this season so far, the four divisions separate on goals, on home advantage and on how often a game ends level. Premier League scored most at 2.91 a game, League Two fewest at 2.48, and home sides won most often in the League Two at 49%.
| Division | Matches | Goals / game | Home wins | Draws | Over 2.5 | Both score |
|---|---|---|---|---|---|---|
| Premier League | 65 | 2.91 | 38% | 29% | 55% | 54% |
| Championship | 131 | 2.89 | 40% | 27% | 62% | 63% |
| League One | 114 | 2.84 | 39% | 30% | 54% | 59% |
| League Two | 126 | 2.48 | 49% | 34% | 43% | 53% |
Measured on each division's completed matches (this season so far) · recomputed on every rebuild
Read the table as a set of base rates rather than a tip sheet. A quarter of all matches in the lower three tiers finish level, which is why draw prices there reward patience more than they do in the top flight, and why a model trained on Premier League scoring will quietly overprice goals everywhere else. Every fixture on this site is priced against its own division's numbers first, then adjusted for the two clubs involved.
The betting picture inverts as you go down. Premier League markets are the most efficient in world football: thousands of traders, huge limits, prices that correct within seconds of team news. League One and League Two markets are softer but shallower: the price may be wrong, and the stake you are allowed may be too small to matter. That trade-off, not a hunch about which division is "easier", is what decides where a value bet is worth having.
Each division page carries the current table, our model's read on the next round of fixtures, and the promotion and relegation rules that actually apply to it. Start with the division you follow: the numbers make more sense when you already know the clubs.
One more thing the four tiers share: a season is long enough for luck to look like form. Over 38 or 46 matches a mid-table side will have a run that makes it look like a contender and a run that makes it look doomed, and neither is usually the truth. That is the argument for a model rather than a memory: it weighs every match played instead of the three you happened to watch, and it says how confident it is rather than pretending certainty.
It is also the argument for reading these pages as a starting point. A table tells you what has happened, a projection tells you what usually follows from here, and neither knows who is injured on Friday. The gap between our number and the bookmaker's price is where a bet lives; the gap between the model and what you know about your own club is where your edge does. Both are worth more than a tip with no working shown.
If you only take one thing from this page, take the comparison above. Four divisions, four sets of base rates, and every fixture on this site priced against the right one. It is a small discipline that quietly decides whether a season of predictions is worth reading.
Frequently Asked Questions
Which English leagues do you cover?
All four professional tiers: the Premier League, Championship, League One and League Two: every club, every fixture, with a full model board for each division rather than the top flight only.
The combined view lives on our football predictions page.
How often do the tables update?
Every matchday. Results are pulled in on a scheduled rebuild, the standings recompute, and the projections move with them.
Before a season starts the tables show the previous campaign's final standings, clearly labelled. See any league page for the current state.
Which division produces the most goals?
This season so far it is the Premier League at 2.91 goals a game, with the League Two lowest at 2.48. The gap is small but it matters: applying top-flight scoring to a lower tier overprices goals all season.
Price any fixture on its own division's numbers in the Prognosis Engine.
Is it easier to find value in the lower divisions?
The prices are softer, but the limits are lower and the markets thinner: a Premier League market has been picked over by thousands of traders, a League Two market by far fewer.
Whether that is worth chasing depends on your staking. Test it in the Bankroll Simulator.
Do you cover the National League?
Not as a league page. We use tier-five results to rate clubs promoted out of it, so a newly promoted side arrives with a real record rather than a guess, but there is no free fixture feed to build a full board on.
Where the data stops, we say so, the method is on our how we rate page.